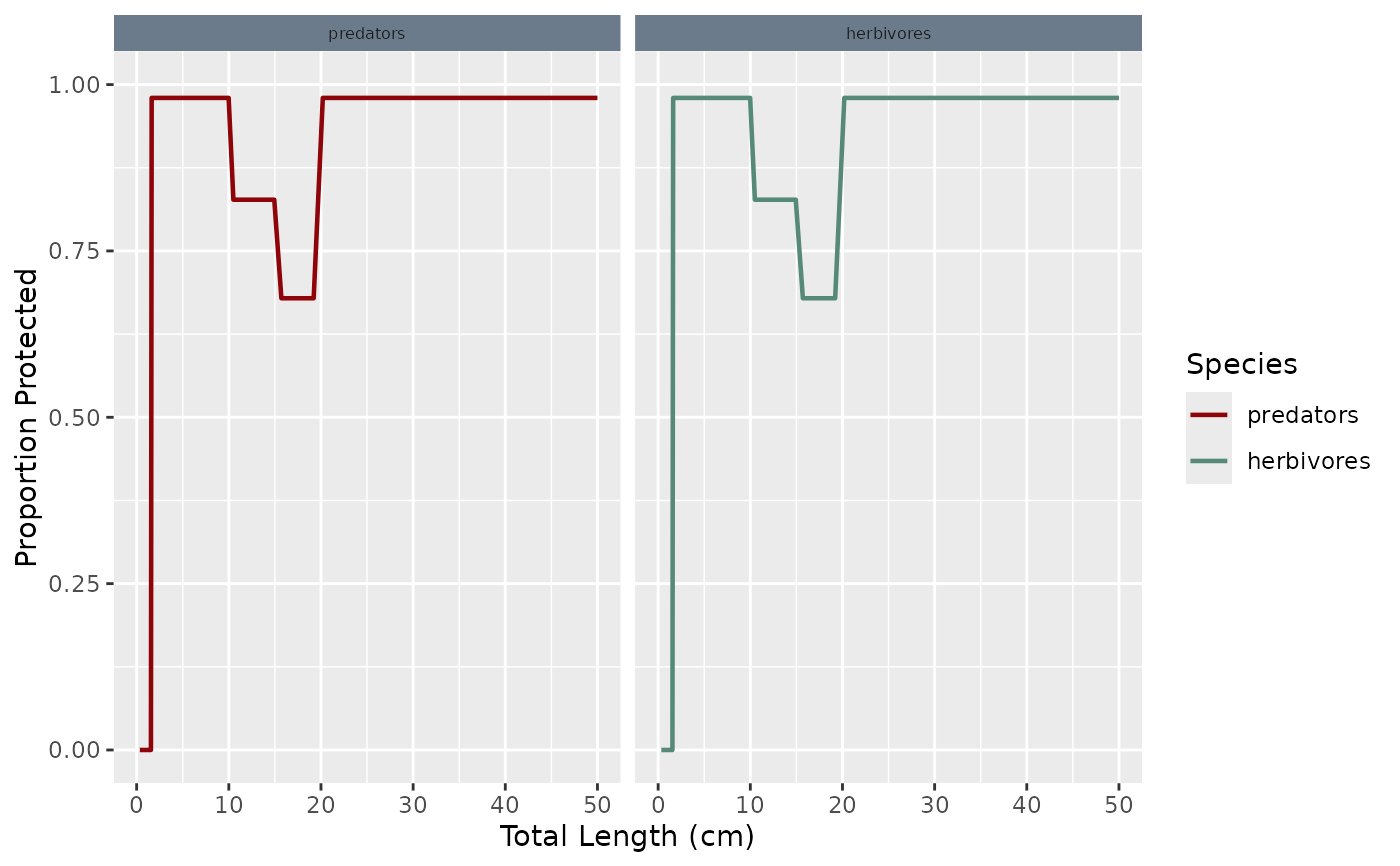
When called with a MizerParams object the initial refuge profile is plotted. The complement of vulnerability.
Usage
plotRefugeProfile(
  object,
  species = NULL,
  all.sizes = FALSE,
  return_data = FALSE,
  ...
)

plotlyRefugeProfile(object, species = NULL, ...)
Arguments
- object
An object of class MizerParams
- species
The species to be selected. Optional. By default all species are selected. A vector of species names, or a numeric vector with the species indices, or a logical vector indicating for each species whether it is to be selected (TRUE) or not.
- all.sizes
If TRUE, then feeding level is plotted also for sizes outside a species' size range. Default FALSE.
- return_data
A boolean value that determines whether the formatted data used for the plot is returned instead of the plot itself. Default value is FALSE.
- ...
unused
See also
plotting_functions, setRefuge(), plotVulnerable()
Other plotting functions:
plot2Productivity(),
plot2TotalBiomass(),
plotDegScale(),
plotDegradationScale(),
plotProductivity(),
plotProductivityRelative(),
plotRefugeDensity(),
plotRelativeContribution(),
plotSpectraChange(),
plotTotalAbundance(),
plotTotalBiomass(),
plotTotalBiomassRelative(),
plotVulnerable()
Examples
data(caribbean_3_model)
plotRefugeProfile(caribbean_3_model)